Identify the Optimal Number of Clusters Based on Maximum Fusion Height
Source:R/maxFusionLevel.R
maxFusionLevel.RdIdentifies the number of clusters corresponding to the largest increase in fusion height in a hierarchical clustering dendrogram.
Arguments
- cluster
An object of class
hclust, typically obtained usingstats::hclust().
Value
A list containing:
- n.clust
Integer vector indicating the number of clusters corresponding to the maximum increase in fusion height. Multiple values may be returned in the case of ties.
- results
A data frame containing:
h: fusion heights.n.clust: number of clusters before each fusion.diff: differences between consecutive fusion heights.
Details
The function calculates the difference between consecutive fusion heights obtained from a hierarchical clustering analysis.
The optimal number of clusters is identified as the number of groups immediately before the largest increase in fusion height.
A large increase suggests that relatively dissimilar clusters are being merged, potentially indicating a meaningful partition of the dataset.
This is a heuristic criterion and does not guarantee the identification of the ecologically or statistically optimal number of clusters. Results may depend on the distance measure and linkage method used.
Examples
# Hierarchical clustering using the USArrests dataset
data(USArrests)

d <- dist(scale(USArrests))
hc <- hclust(d, method = "ward.D2")

# Identify the number of clusters
res <- maxFusionLevel(hc)

# Suggested number of clusters
res$n.clust
#> [1] 2

# Fusion heights and their differences
res$results
#>             h n.clust        diff
#> 1   0.2058539      50          NA
#> 2   0.3502188      49 0.144364899
#> 3   0.4287712      48 0.078552416
#> 4   0.4940832      47 0.065312015
#> 5   0.5353893      46 0.041306068
#> 6   0.5535286      45 0.018139387
#> 7   0.5935343      44 0.040005700
#> 8   0.6559259      43 0.062391556
#> 9   0.7038309      42 0.047905009
#> 10  0.7108812      41 0.007050268
#> 11  0.7389936      40 0.028112413
#> 12  0.7722224      39 0.033228861
#> 13  0.7781298      38 0.005907377
#> 14  0.7865674      37 0.008437523
#> 15  0.7977642      36 0.011196804
#> 16  0.8076434      35 0.009879204
#> 17  0.8472042      34 0.039560844
#> 18  0.9427614      33 0.095557211
#> 19  0.9513719      32 0.008610445
#> 20  0.9824857      31 0.031113824
#> 21  1.0122252      30 0.029739526
#> 22  1.0598104      29 0.047585190
#> 23  1.0709720      28 0.011161575
#> 24  1.0756115      27 0.004639495
#> 25  1.0910920      26 0.015480576
#> 26  1.1606271      25 0.069535066
#> 27  1.1968261      24 0.036198967
#> 28  1.2074603      23 0.010634257
#> 29  1.2601290      22 0.052668642
#> 30  1.2990516      21 0.038922610
#> 31  1.3169658      20 0.017914169
#> 32  1.3449118      19 0.027946047
#> 33  1.3901014      18 0.045189630
#> 34  1.5396377      17 0.149536250
#> 35  1.6907596      16 0.151121938
#> 36  1.7484165      15 0.057656842
#> 37  1.8118061      14 0.063389664
#> 38  1.9360777      13 0.124271589
#> 39  2.2033391      12 0.267261385
#> 40  2.2421782      11 0.038839123
#> 41  2.7145543      10 0.472376097
#> 42  2.9932892       9 0.278734904
#> 43  3.0250236       8 0.031734392
#> 44  3.2107135       7 0.185689846
#> 45  3.4960481       6 0.285334652
#> 46  3.7341155       5 0.238067364
#> 47  6.4618664       4 2.727750963
#> 48  7.1881893       3 0.726322905
#> 49 13.5162424       2 6.328053004

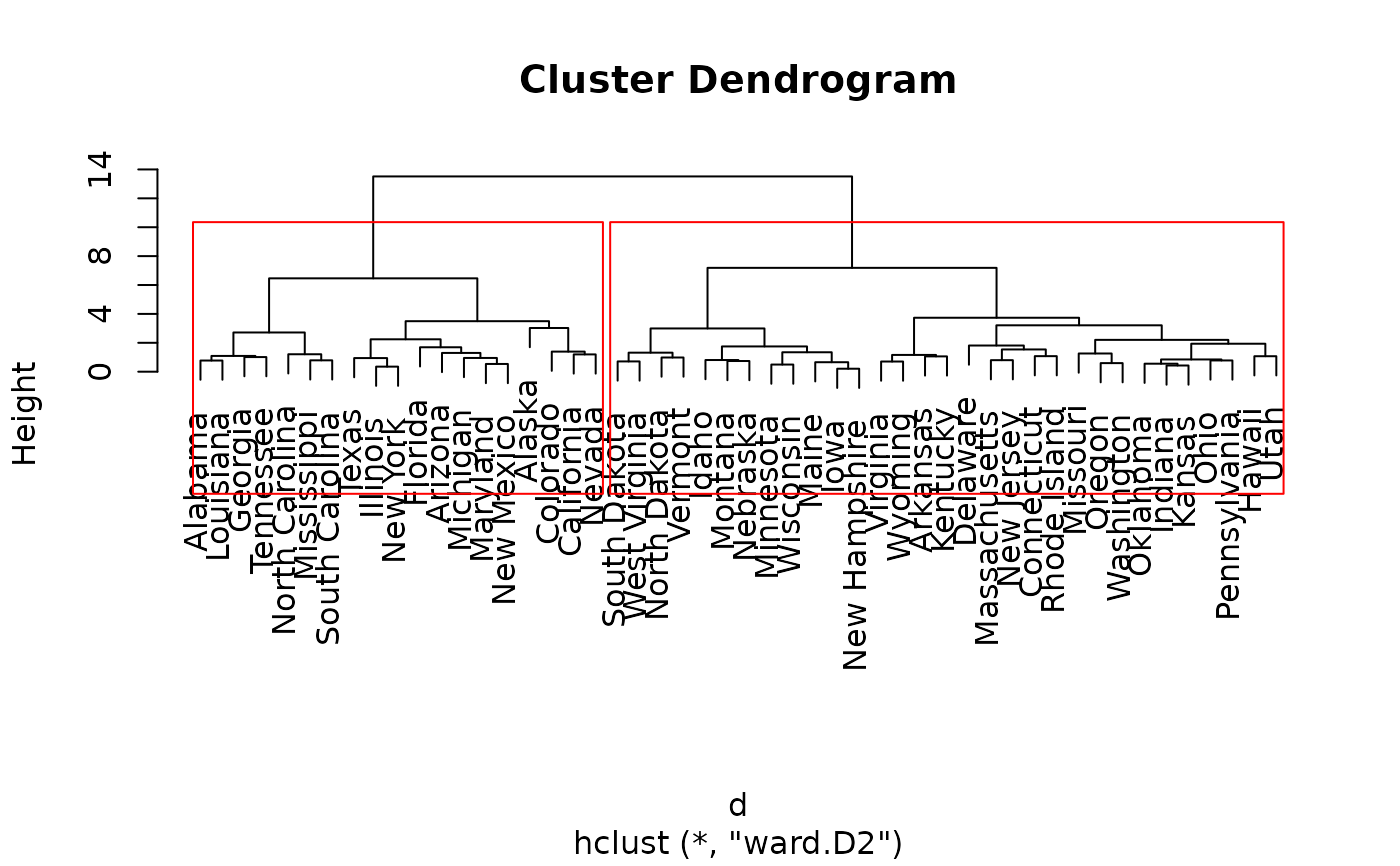
# Plot the dendrogram with the suggested partition
plot(hc)
rect.hclust(hc, k = res$n.clust[1], border = "red")