Introduction to iPastoralist
Marco Pittarello
Source:vignettes/Introduction_to_iPastoralist.Rmd
Introduction_to_iPastoralist.RmdWhen to use it
Botanical composition was surveyed either with phytosociological or point-quadrat / pinpoint (or point‐intercept) method (plant species are recorded at fixed interval along a linear transect, Daget and Poissonet 1971).
If botanical composition was surveyed with the point-quadrat / pinpoint (or point‐intercept) method, iPastoralist works also when the list of all other plant species included within a buffer area around the transect line (i.e. vegetation plot) has been done. Indeed, the point-intercept method often miss rare species.
What it does
Point-quadrat / pinpoint (or point‐intercept) method
iPastoralist allows you to:
- Transform Frequency of occurrences (FO) of species
identified along a linear transect (either with or without occasional
species) to:
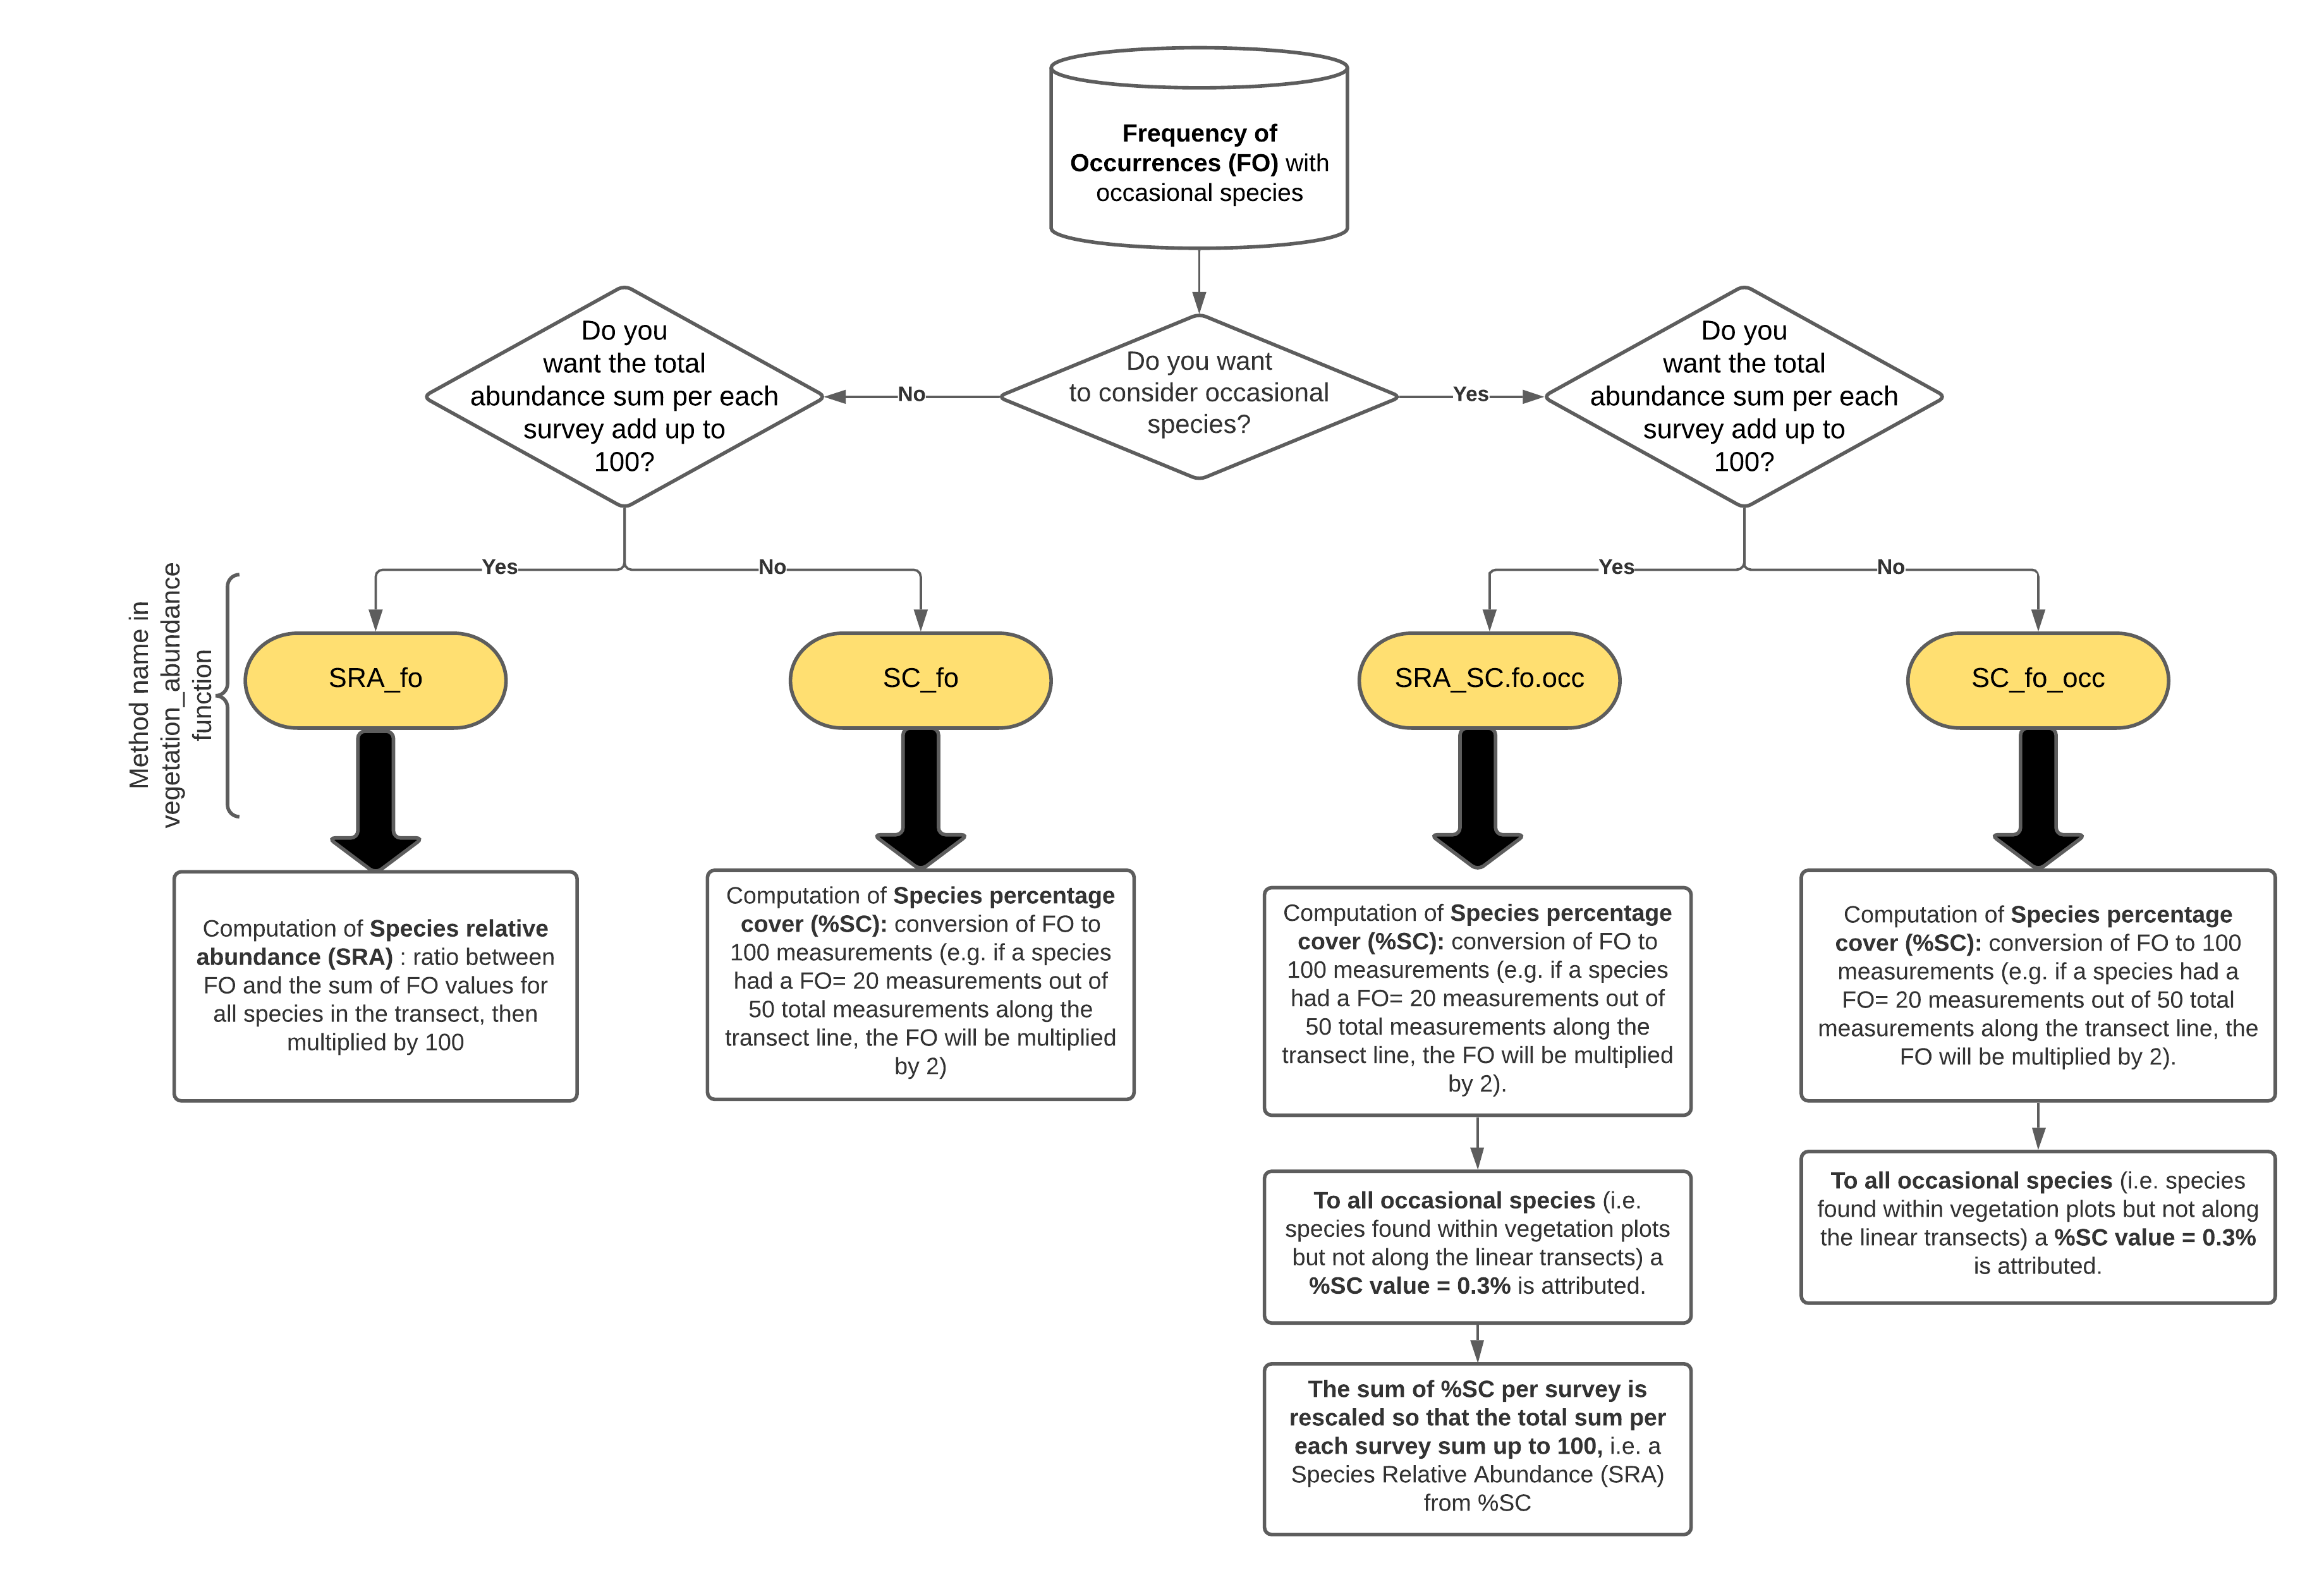
- Species relative abundance (SRA) : ratio between frequency of occurrence and the sum of frequency of occurrences values for all species in the transect, then multiplied by 100;
- Species percentage cover (%SC): conversion of frequency of occurrence to 100 measurements (e.g. if a species had a FO= 20 measurements out of 50 total measurements along the transect line, the FO will be multiplied by 2). To all occasional species (i.e. species found within vegetation plots but not along the linear transects) a %SC value = 0.3% is attributed. More details are provided in the vegetation_abundance function, which process FO data with the following workflow:

- Compute:
- Biodiversity indexes: Species richness, Shannon diversity index, Effective Number of Species (ENS), Shannon max, Equitability. (see “biodiversity” function)
- Forage Pastoral Value (PV) (see “pastoral_value” function)
- Ecological indexes: Landolt, Ellenberg (either weighted or not weighted with plant species abundance and either considering or not considering occasional species). (see “ecological_indexes” function)
- Extract for each survey the firt ten species, ordered decreasingly by their abundance (useful with dendrograms). (see “first_ten_species” function)
Phytosociological method
With the ‘PhytoCover’ function, iPastoralist allows you to transform species cover visually estimated in a phytosociological survey to:
- Braun-Blanquet cover-abundance scale (Braun-Blanquet,1932)
- Van Der Maarel cover-abundance scale (Van Der Maarel, 1978)
- Dominance percentage (Tasser and Tappeiner, 2005)
Conversion table
| Visually estimated cover (%) | Braun Blanquet | Van Der Maarel | Tasser and Tappeiner (%) |
|---|---|---|---|
| 0 | 0 | 0 | 0 |
| <1 | + | 2 | 0.3 |
| 1 - 5 | 1 | 3 | 2.8 |
| 6 -15 | 2a | 5 | 10 |
| 16-25 | 2b | 5 | 20.5 |
| 26-50 | 3 | 7 | 38 |
| 51-75 | 4 | 8 | 63 |
| 76-100 | 5 | 9 | 88 |
References
Braun-Blanquet J (1932) Plant sociology. The study of plant communities. GD Fuller and HS Conard (Eds.). Authorized English translations of ‘Pflanzensoziologie’. 1st ed. Printed in the United States of America. New York and London: McGraw-Hill Book Co. Inc.
Daget, P., Poissonet, J., (1971). A method of plant analysis of pastures. Ann. Agron. 22, 5–41.
Tasser E, Tappeiner U (2005) New model to predict rooting in diverse plant community compositions. Ecological Modelling 185:195-211.
Van der Maarel, E. (1979). Transformation of cover-abundance values in phytosociology and its effects on community similarity. Vegetatio, 39(2), 97-114.